Infographics 101: What They Are and How to Make Them
- By ramin
- March 9, 2021
- 5:19 pm
Do you have a bunch of great information that your viewers could really benefit from hearing?
A great way to present it all to them in a simple, fun, and easy-to-understand way is by creating an infographic!
What’s an Infographic?
An infographic is defined by the Oxford English Dictionary as a “visual representation of information or data.” Basically, it’s just a picture or a series of pictures or graphics that serve as an explanatory aid of a topic, trend, statistic, report, and more.
The human brain processes images 60,000 times faster than text (T-sciences), so infographics are particularly useful if you’re looking to provide information on more complex ideas. They can also help to poise your company as an expert and a thought leader in your field, but you still need to make sure you’re doing more than trying to build some excitement and engagement around your brand — above all else, an infographic must serve to teach your viewers something.
Whether you want to compare and contrast the differences between your products and services, display research findings or survey data, or summarize longer reports and writings, an infographic is the perfect vehicle to do all that while also bringing in more viewers, interactions, and sales. In fact, infographics and other colorful visuals can increase sales by up to 80 percent (Xerox).
How to Create an Infographic
If you want to create an infographic, there are many online platforms out there that will help you get the ball rolling with examples and templates.
Here are some of the most commonly used ones:
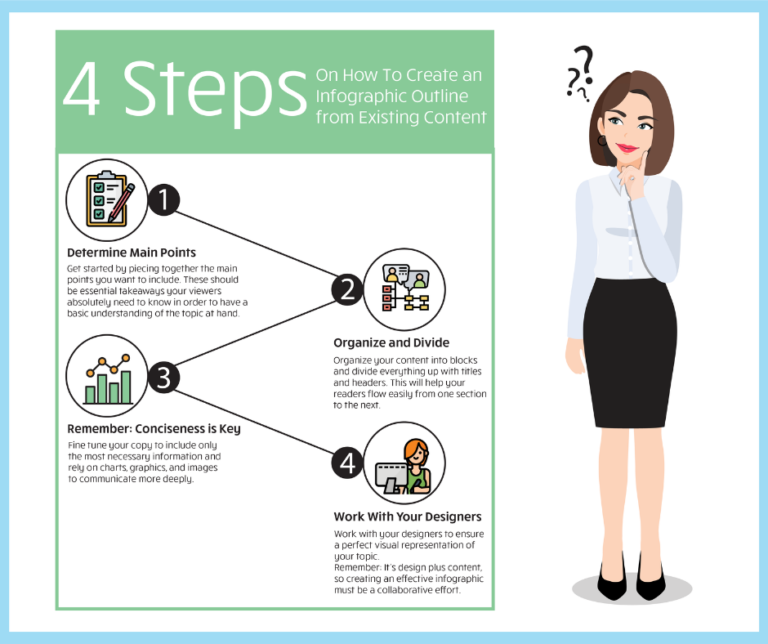
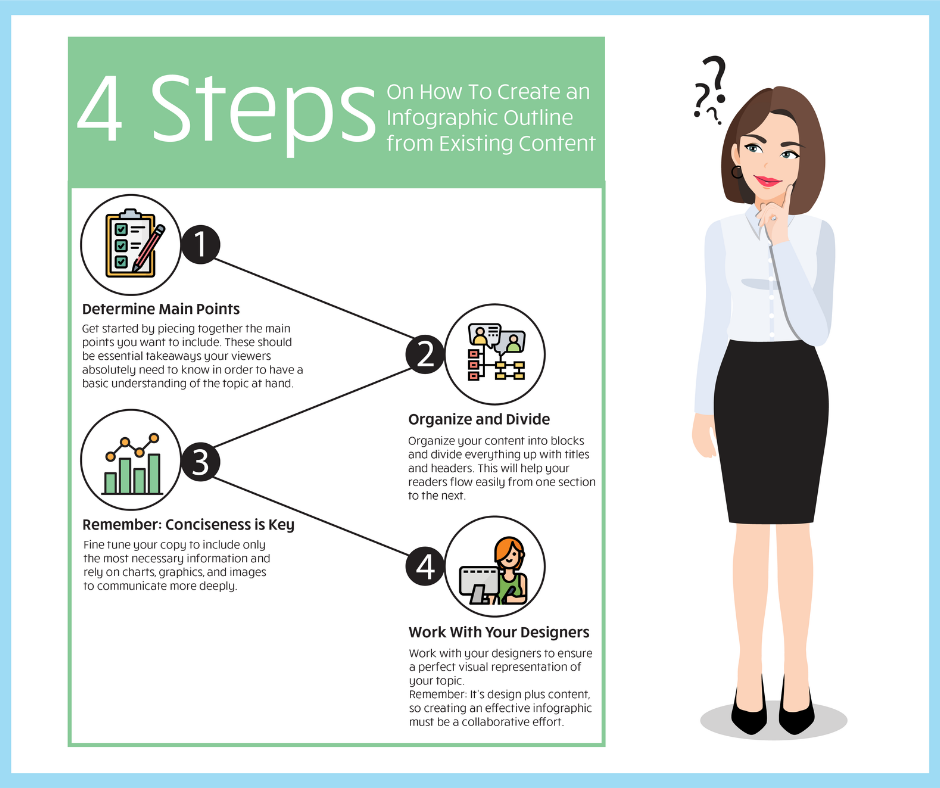
However, if you decide to go the organic route, check out this infographic we made about how to create infographics!
Where to Use Infographics
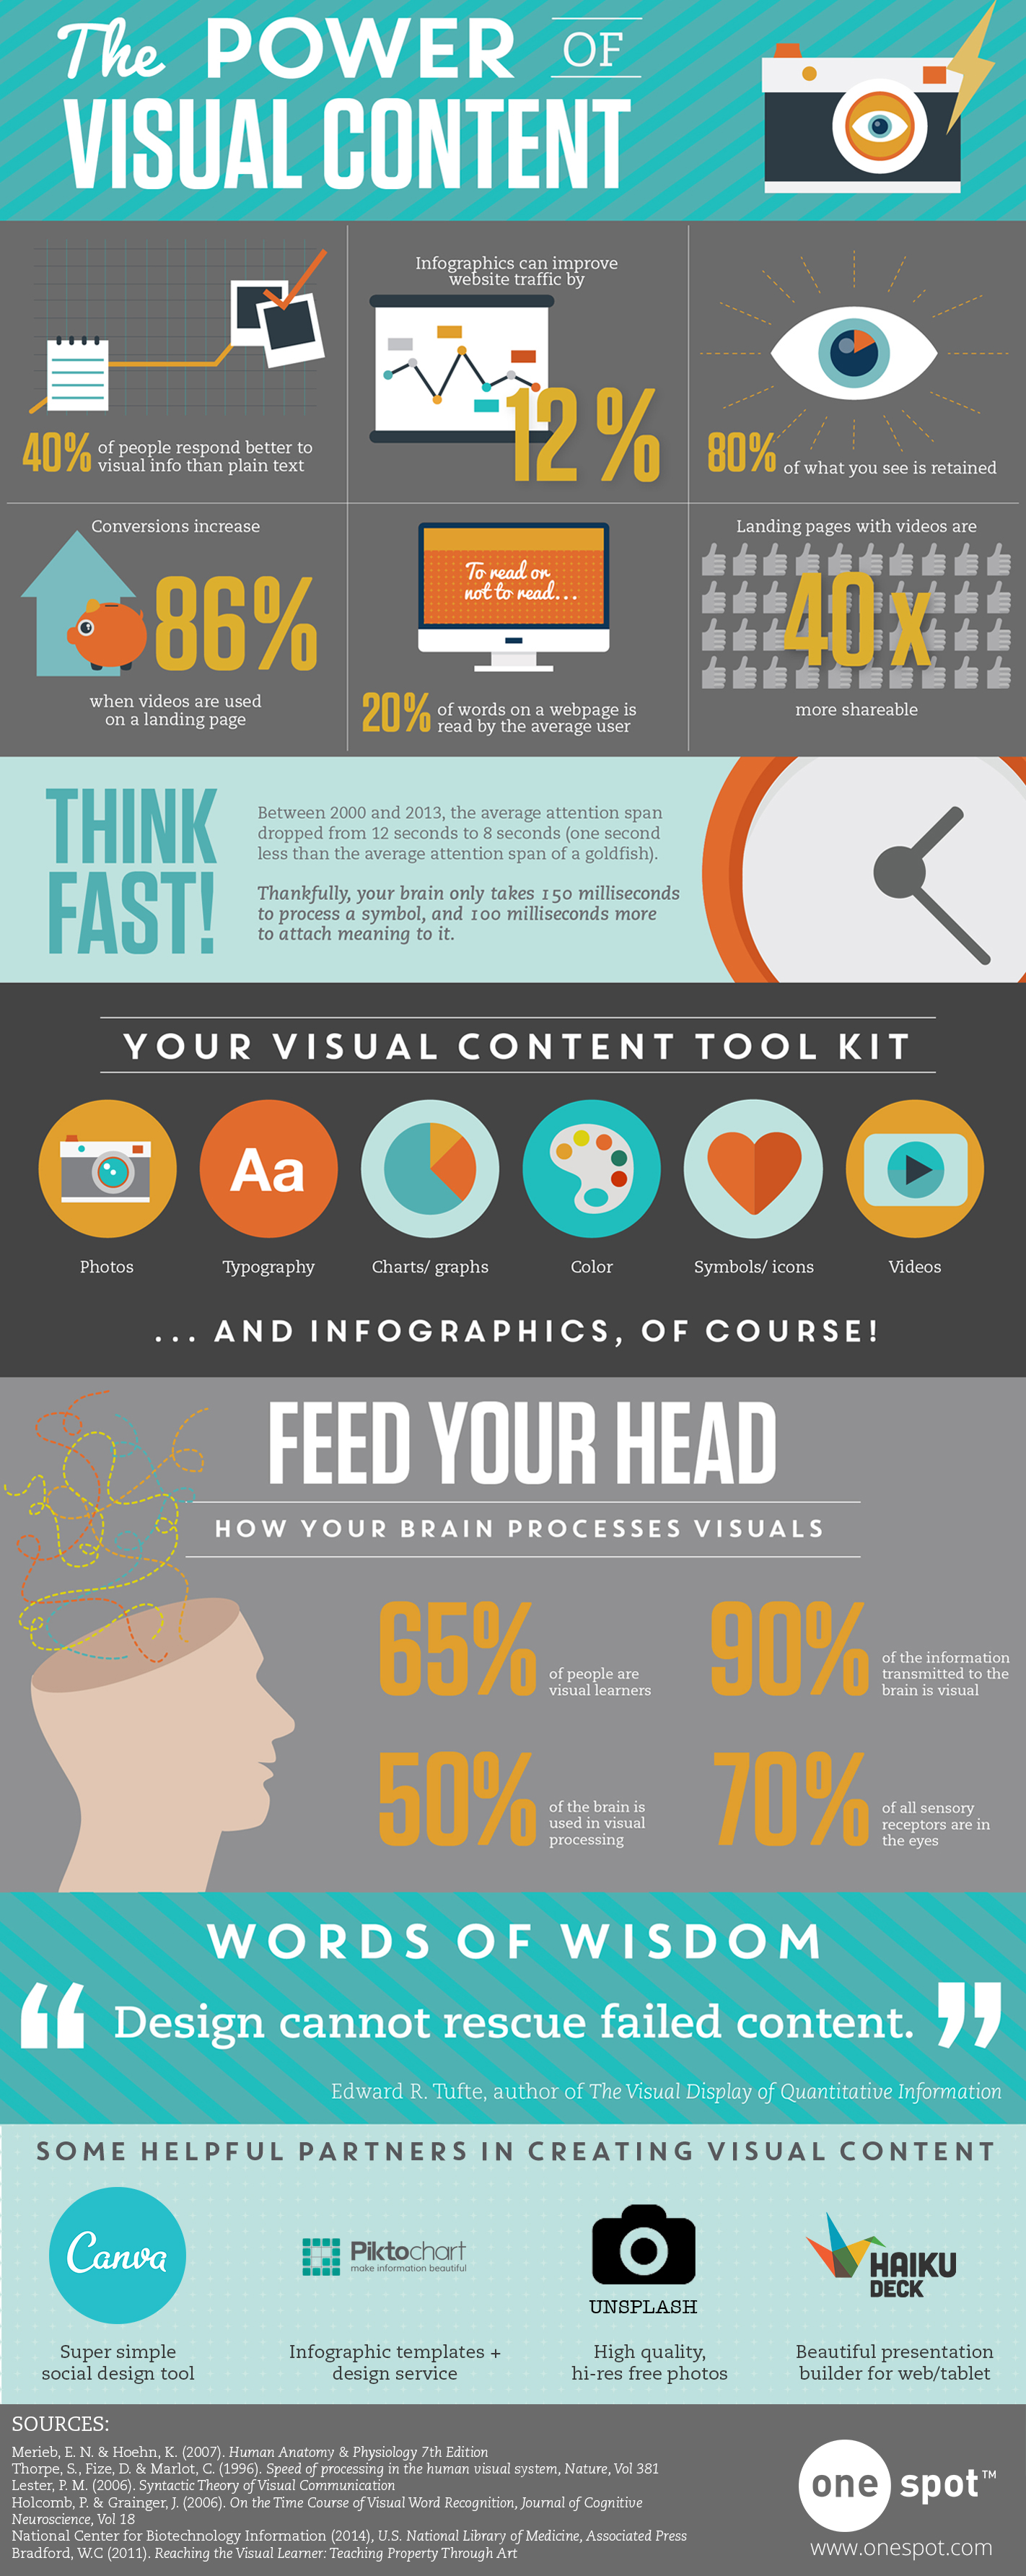
- On your website and landing pages! In fact, infographics can increase website traffic by up to 12 percent (One Spot).
- Your blog and email campaigns, as infographics are 30 times more likely to be read in their entirety than blog posts or articles (Digital Information World).
- As a sales tool with a concrete call to action! When directions are accompanied by visuals, readers are 323 percent more likely to complete the action described (Springer).
- On your social media pages, as infographics are liked and shared more than any other type of content on social media (NN Group).
- Anywhere else you think they will aid in the explanation of a larger topic, like in your webinar, e-book, online course, slideshow, presentation, and more!
Thanks for Reading!
Thanks for taking the time to learn about infographics with us! If you think you could use a hand in creating some for yourself, our team of copywriters and designers here at OpticTour would love to put our heads together to do it for you so you can focus on running your business.
Whenever you’re ready, you can schedule a time to talk with us by filling out this contact form.
8863 Anderson Mill Road, Suite 117
Austin, Texas
78729
© 2019 Optictour. Trademarks and brands are the property of their respective owners.
Google and the Google logo or any other related screenshots are registered trademarks of Google LLC, used with permission.